
Concept explainers
a)
To determine: The results of the run test.
Introduction: Run chart refers to a line graph that displays the recorded data based on the time sequence.
a)
Answer to Problem 14P
Explanation of Solution
Given information:
| Test | z-score |
| Median | +1.37 |
| Up/Down | +1.05 |
By observing the given data of median +1.37 (< ±2) and up/down +1.05 (< ±2), it can be concluded that they are within the statistical limits of ±2.
Hence, the result of the run test suggests that the output possess randomness.
b)
To determine: The results of the run test.
Introduction: Run chart refers to a line graph that displays the recorded data based on the time sequence.
b)
Answer to Problem 14P
Explanation of Solution
Given information:
Formula:
Calculation of expected number of runs:
Observed number of runs = 14
The expected number of runs is calculated by adding half of the total number of samples with 1 which gives 11.
Calculation of standard deviation:
Standard deviation is calculated by subtracting number of sample 20 from 1 and dividing the resultant by 4 and taking square for the value which yields 2.18.
The z factor for median is calculated by dividing the difference of 14 and 11 with 2.18 which yields +1.38 which is within the test statistics of ±2.00 and no non-randomness exist.
Up/Down Test:
The observed number of runs is 8.
Calculation of expected number of runs:
The expected number of runs is calculated by subtracting the double of the number of samples 20 and subtracting from1 and dividing the resultant with 3 which gives 13.
Calculation of standard deviation:
Standard deviation is calculated by multiplying the number of samples with 16 and subtracting the resultant from 29 and then dividing the resulting value with 90 and taking square root which yields 1.80.
The z factor for median is calculated by dividing the difference of 8 and 13 with 1.80 which yields -2.78 which is beyond the test statistics of ±2.00 which is non-random.
Hence, the result of the median run test is random and up/down test is no non randomness is detected.
c)
To determine: The results of the run test.
Introduction: Run chart refers to a line graph that displays the recorded data based on the time sequence.
c)
Answer to Problem 14P
Explanation of Solution
Given information:
| Cable | 1 | 2 | 3 | 4 | 5 | 6 | 7 | 8 | 9 | 10 | 11 | 12 | 13 | 14 |
| Defects | 2 | 3 | 1 | 0 | 1 | 3 | 2 | 0 | 2 | 1 | 3 | 1 | 2 | 0 |
Formula:
Analysis of data:
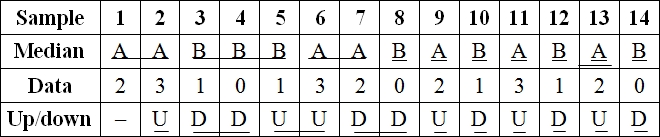
To make analysis of data, the given data is compared with median (center line) to make A/B and U/D which is shown below,
Median run test:
From analysis, the observed number of runs is 10 and median is 1.5.
Calculation of expected number of runs:
The expected number of runs is calculated by adding half of the total number of samples with 1 which gives 8.
Calculation of standard deviation:
Standard deviation is calculated by subtracting number of sample 14 from 1 and dividing the resultant by 4 and taking square for the value which yields 1.80.
The z factor for median is calculated by dividing the difference of 10 and 8 with 1.80 which yields +1.11 which is within the test statistics of ±2.00 and no non-randomness exist.
Up/Down Test:
The observed number of runs from the analysis is 10.
Calculation of expected number of runs:
The expected number of runs is calculated by subtracting the double of the number of samples 14 and subtracting from1 and dividing the resultant with 3 which gives 9.0.
Calculation of standard deviation:
Standard deviation is calculated by multiplying the number of samples with 14 and subtracting the resultant from 29 and then dividing the resulting value with 90 and taking square root which yields 1.47.
The z factor for median is calculated by dividing the difference of 10 and 9 with 1.47 which yields +0.68which is within the test statistics of ±2.00.
Hence, the results of the median run test and up/down test is random and no non randomness is detected.
d)
To determine:The results of the run test.
Introduction: Run chart refers to a line graph that displays the recorded data based on the time sequence.
d)
Answer to Problem 14P
Explanation of Solution
Given information:
| Day | 1 | 2 | 3 | 4 | 5 | 6 | 7 | 8 | 9 | 10 | 11 | 12 | 13 | 14 |
| Comp. | 4 | 10 | 14 | 8 | 9 | 6 | 5 | 12 | 13 | 7 | 6 | 4 | 2 | 10 |
Formula:
Analysis of data:
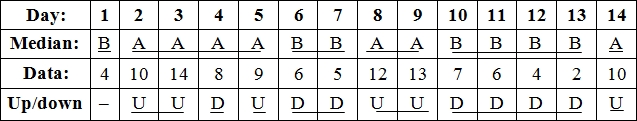
To make analysis of data, the given data is compared with median (center line) to make A/B and U/D which is shown below,
Median run test:
From analysis, the observed number of runs is 8.
Calculation of expected number of runs:
The expected number of runs is calculated by adding half of the total number of samples with 1 which gives 8.
Calculation of standard deviation:
Standard deviation is calculated by subtracting number of sample 14 from 1 and dividing the resultant by 4 and taking square for the value which yields 1.80.
The z factor for median is calculated by dividing the difference of 6 and 8 with 1.80 which yields -1.11 which is beyond the test statistics of ±2.00 and non-randomness exist.
Up/Down Test:
The observed number of runs from the analysis is 7.
Calculation of expected number of runs:
The expected number of runs is calculated by subtracting the double of the number of samples 26 and subtracting from1 and dividing the resultant with 3 which gives 9.0.
Calculation of standard deviation:
Standard deviation is calculated by multiplying the number of samples with 16 and subtracting the resultant from 29 and then dividing the resulting value with 90 and taking square root which yields 1.47.
The z factor for median is calculated by dividing the difference of 7 and 9 with 1.47 which yields -1.36 which is within the test statistics of ±2.00.
Hence, the results of the median run test and up/down test is random and no non randomness is detected.
Want to see more full solutions like this?
Chapter 10 Solutions
Operations Management


- what types of error are attached in statistical process control? define and draw example. Sub: operation and supply chain managementarrow_forwardProblem 10-4 (Static) Software upgrade times (in minutes) are being evaluated. Samples of five observations each have been taken, and the results are as listed. 1 79.2 78.8 80.0 78.4 81.0 Number of Observations in Subgroup, n 2 4 5 6 7 8 9 Click here for the Excel Data File Factors for three-sigma control limits for and Rcharts 10 11 13 12 13 14 SAMPLE 2 4 3 80.5 79.6 78.9 78.7 81.0 80.4 79.7 79.6 79.4 80.4 79.4 80.1 80.6 15 16 17 18 19 20 80.3 80.8 Factor for I Chart, A2 1.88 1.02 0.73 0.58 0.48 0.42 5 6 80.5 79.7 79.6 80.6 80.4 80.5 80.8 80.0 78.8 81.1 0.37 0.34 0.31 0.29 0.27 0.25 0.24 0.22 0.21 0.20 0.19 0.19 0.18 FACTORS FOR R CHARTS Lower Upper Control Limit, D3 Control Linit, D4 3.27 2.57 2.28 2.11 2.00 1.92 1.86 1.82 1.78 1.74 1.72 1.69 1.67 1.65 1.64 1.62 1.61 1.60 1.59 0 8 0 0 0 0.08 0.14 0.18 0.22 0.26 0.28 0.31 0.33 0.35 0.36 0.38 0.39 0.40 0.41arrow_forwardProduction phase After the pre-production phase, the product entered the production phase without introducing any changes in the process. Since it seemed to be stable SPC was not performed for several months, with process stability and variability being assessed by the level of nonconformities it it produced. However, after a time, an increasing number of customer complaints due to products supplied outside the specification/. The Quality Engineer decided to take 20 samples from the process with regular spacing between samples. Each sample is made up of 3 parts. The data obtained for the highlighted dimension samples are presented in Table 2 below: measurements in mm for critical sample dimension number 1 2 3 4 5 6 7 8 9 Observations 2 3 50.767 1 50.972 50.785 50.956 50.97 50.914 51.066 50.933 51.086 50.917 51.081 51.092 50.948 50.828 51.054 50.859 51.083 50.789 50.984 50.961 50.943 51.013 51.02 50.734 50.898 50.956 50.885 51.004 50.984 50.839 Table 2: Measurements in mm for critical…arrow_forward
- Sam’s Long Life 60-watt light bulbs are designed to have a life of 1,350 hours with tolerance of ± 340 hours. A recent representative sample from the process that makes these light bulbs revealed a mean of 1,290 hours, with a standard deviation of 94 hours. Compute a. Compute the process capability ratio and the process capability index, and comment on the overall capability of the process b. Explain to what extent the process for producing Sam’s Long Life 60-watt light bulbs would have to be improved to achieve 4-sigma quality. c. show detail workarrow_forwardA shirt manufacturer buys clothes by the 100-yard roll from a supplier. For setting a control chart to manage the irregularities (e.g., loose threads and tears), the following data were collected from a sample provided by the supplier. Sample 1 2 3 4 5 6 7 8 9 10 Irregularities 3 5 2 6 5 4 6 3 4 5 Which type of control chart should be used? Construct a control chart with two-sigma control limits. Suppose the next five rolls from the supplier had three, two, five, three, and seven irregularities. Is the supplier process under control? Explain and show workarrow_forwardAuto pistons at Wemming Chung's plant in Shanghai are produced in a forging process, and the diameter is a critical factor that must be controlled. From sample sizes of 10 pistons produced each day, the mean and the range of this diameter have been as follows: a) What is the value of x? x= 156.76 mm (round your response to two decimal places). b) What is the value of R? Day 1 2 3 4 5 Mean x (mm) 158.9 155.2 155.6 157.5 156.6 R = 4.40 mm (round your response to two decimal places). c) What are the UCL and LCL using 3-sigma? Upper Control Limit (UCL) = mm (round your response to two decimal places). Range R (mm) 4.2 4.4 4.3 4.8 4.3 Çarrow_forward
- The Minnow County Highway Safety Department monitors accidents at the intersection of Routes 123and 14. Accidents at the intersection have averaged three per month.a. Which type of control chart should be used? Construct a control chart with three-sigma controllimits.b. Last month, seven accidents occurred at the intersection. Is this sufficient evidence to justify aclaim that something has changed at the intersection?arrow_forward A fast food franchise tracked the number of errors that occurred in customers orders. These included; * wrong menu items *wrong size drink *lack of condiments *wrong price total *and so on... Some orders may have more than one error. In one week, 1500 orders were filled, and a total of 72 errors were discovered. Find the control limits for a C – Chart to monitor the number of errors per order. Is order accuracy, good or bad ? Explain.arrow_forwardThe following is a control chart for the average number of minor errors in 22 service reports. UCL LCL a. Calculate the observed mean, expected mean, standard deviation and z value for the median and up/down test. Use z = +/-2 to compare your z test scores. (Negative amounts should be indicated by a minus sign. Round your answers to 2 decimal places.) Test Observed Expected Std. dev Median Up/Downarrow_forward
- Why is it usually desirable to use both a median run test and an up/down run test on the same data in an production of organization ?arrow_forwardThe operations manager of thebooking services departmentof Hometown Bank is concerned about the number ofwrong customer account numbers recorded by Hometownpersonnel. Each week a random sample of 2,500 depositsis taken, and the number of incorrect account numbers is recorded. The results for the past12 weeks are shown in thefollowing table. Is the bookingprocess out of statistical control? Use three-sigma controllimits, which will provide a typeI error of 0.26 percent.arrow_forwardWhy is it usually desirable to use both a median run test and an up/down run test on the samedata?arrow_forward
 Practical Management ScienceOperations ManagementISBN:9781337406659Author:WINSTON, Wayne L.Publisher:Cengage,
 Operations ManagementOperations ManagementISBN:9781259667473Author:William J StevensonPublisher:McGraw-Hill Education
 Operations and Supply Chain Management (Mcgraw-hi...Operations ManagementISBN:9781259666100Author:F. Robert Jacobs, Richard B ChasePublisher:McGraw-Hill Education
 Purchasing and Supply Chain ManagementOperations ManagementISBN:9781285869681Author:Robert M. Monczka, Robert B. Handfield, Larry C. Giunipero, James L. PattersonPublisher:Cengage Learning
 Production and Operations Analysis, Seventh Editi...Operations ManagementISBN:9781478623069Author:Steven Nahmias, Tava Lennon OlsenPublisher:Waveland Press, Inc.