
Essentials of Business Analytics (MindTap Course List)
2nd Edition
ISBN: 9781305627734
Author: Jeffrey D. Camm, James J. Cochran, Michael J. Fry, Jeffrey W. Ohlmann, David R. Anderson
Publisher: Cengage Learning
expand_more
expand_more
format_list_bulleted
Concept explainers
Videos
Textbook Question
Chapter 15, Problem 23P
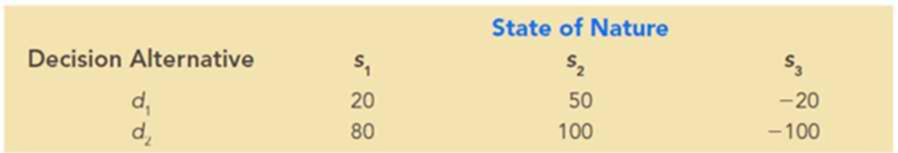
In Problem 22, if P(s1) = 0.25, P(s2) = 0.50, and P(s3) = 0.25, find a recommended decision for each of the three decision makers. (Note: For the same decision problem, different utilities can lead to different decisions.)
22. Three decision makers have assessed utilities for the following decision problem (payoff in dollars):
The indifference
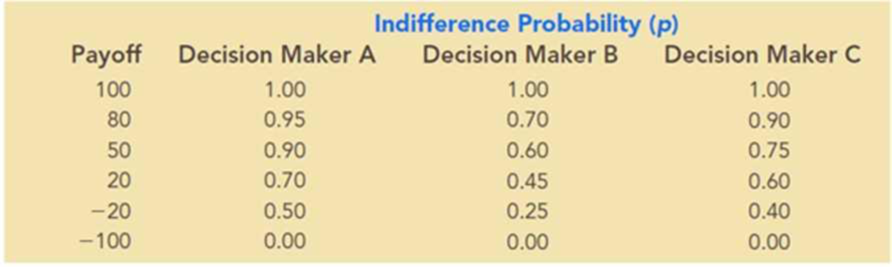
- a. Plot the utility
function for money for each decision maker. - b. Classify each decision maker as a risk avoider, a risk taker, or risk-neutral.
- c. For the payoff of 20, what is the premium that the risk avoider will pay to avoid risk? What is the premium that the risk taker will pay to have the opportunity of the high payoff?
Expert Solution & Answer
Want to see the full answer?
Check out a sample textbook solution
Students have asked these similar questions
Q. No. 3. To the Board of Revenue , the deductions depends on the taxpayer’s adjusted gross income. Large deductions, which include charity and medical deductions, are more reasonable for taxpayers with large adjusted gross incomes. If a taxpayer claims larger than average itemized deductions for a given level of income, the chances of an audit are increased. Data (in thousands of dollars) on adjusted gross income and the average or reasonable amount of itemized deductions are as follows:
a. Develop a scatter diagram with adjusted gross income as the independent variable.b. Determine the correlation coefficient.c. Determine the standard error of estimated. Determine the coefficient of determination and interpret it.e. At the .05 significance level, is it reasonable to conclude that there is a positive relationship between the variables? What is the p-value?f. Develop the estimated regression equation.g. Estimate a reasonable level of total itemized deductions for a taxpayer with an…
In general,
% of the values in a data set lie at or below the median.
% of the values in a data set lie at or below the third quartile (Q3).
If a sample consists of 1300 test scores,
of them would be at or below the second quartile (Q2).
If a sample consists of 1300 test soores,
of them would be at or above the first quartile (Q1).
4. For each of the following situations, state the independent variable and the dependent variable.
a. A study is done to determine if elderly drivers are involved in more motor vehicle fatalities than other drivers. The number of fatalities per 100,000 drivers is compared to the age of drivers.
b. A study is done to determine if the weekly grocery bill changes based on the number of family members.
c. Insurance companies base life insurance premiums partially on the age of the applicant.
d. Utility bills vary according to power consumption.
e. A study is done to determine if a higher education reduces the crime rate in a population
Chapter 15 Solutions
Essentials of Business Analytics (MindTap Course List)
Ch. 15 - Prob. 1PCh. 15 - Southland Corporation’s decision to produce a new...Ch. 15 - Amy Lloyd is interested in leasing a new Honda and...Ch. 15 - Investment advisors estimated the stock market...Ch. 15 - Hudson Corporation is considering three options...Ch. 15 - Prob. 6PCh. 15 - Myrtle Air Express decided to offer direct service...Ch. 15 - Video Tech is considering marketing one of two new...Ch. 15 - Seneca Hill Winery recently purchased land for the...Ch. 15 - Hemmingway, Inc. is considering a $5 million...
Ch. 15 - The following profit payoff table was presented in...Ch. 15 - Suppose that you are given a decision situation...Ch. 15 - A firm has three investment alternatives. Payoffs...Ch. 15 - Alexander Industries is considering purchasing an...Ch. 15 - In a certain state lottery, a lottery ticket costs...Ch. 15 - Three decision makers have assessed utilities for...Ch. 15 - In Problem 22, if P(s1) = 0.25, P(s2) = 0.50, and...Ch. 15 - Translate the following monetary payoffs into...Ch. 15 - Consider a decision maker who is comfortable with...
Knowledge Booster


Learn more about
Need a deep-dive on the concept behind this application? Look no further. Learn more about this topic, statistics and related others by exploring similar questions and additional content below.Similar questions
- When 20 employees were first hired in 2011 for a creative engineering firm, Company A, the starting annual salary was $35,000. A competing creative engineering firm, Company B, had the same starting salary for 20 employees hired the same year. In 2016, data was collected on the annual salaries of the same employees at each of the two companyies. This data is displayed in the box plot shown. Part A: Compare the annual salary distributions and what are the pros and cons of working at each company? Explain using what you found in Part Aarrow_forwardRick Miller has just opened a new bakery in Frisco, Colorado, called Morning Fresh. In performing an economic analysis, Rick has determined that the marginal cost or loss for each dozen doughnuts sold is $4. The marginal profit is estimated to be $2.75 per dozen doughnuts. At this time, Rick is considering stocking 10, 15, 20, 25 or 30 dozen doughnuts. The probability of selling 10 dozen doughnuts is 10%. The chance of selling 15 Dozen doughnuts is 20%. There is a 30% chance that Morning Fresh will sell either 20 or 25 dozen doughnuts. Finally, there is a 10% chance of selling 30 dozen doughnuts, which is considered by Rick to be the most that Morning Fresh would be able to accommodate. What is your recommendation to Rick ?arrow_forwardThe amount of income spent on housing is an important component of the cost of living. The total costs of housing for homeowners might include mortgage payments, property taxes, and utility costs (water, heat, electricity). An economist selected a sample of 20 homeowners in New England and then calculated these total housing costs as a percent of monthly income, 5 years ago and now. The information is reported below. Is it reasonable to conclude the percent is less now than 5 years ago? Homeowner Five Years Ago Now Homeowner Five Years Ago Now 1 17 % 10 % 11 35 % 32 % 2 20 39 12 16 32 3 29 37 13 23 21 4 43 27 14 33 12 5 36 12 15 44 40 6 43 41 16 44 42 7 45 24 17 28 22 8 19 26 18 29 19 9 49 28 19 39 35 10 49…arrow_forward
arrow_back_ios
arrow_forward_ios
Recommended textbooks for you
 MATLAB: An Introduction with ApplicationsStatisticsISBN:9781119256830Author:Amos GilatPublisher:John Wiley & Sons Inc
 Probability and Statistics for Engineering and th...StatisticsISBN:9781305251809Author:Jay L. DevorePublisher:Cengage Learning
 Statistics for The Behavioral Sciences (MindTap C...StatisticsISBN:9781305504912Author:Frederick J Gravetter, Larry B. WallnauPublisher:Cengage Learning
 Elementary Statistics: Picturing the World (7th E...StatisticsISBN:9780134683416Author:Ron Larson, Betsy FarberPublisher:PEARSON
 The Basic Practice of StatisticsStatisticsISBN:9781319042578Author:David S. Moore, William I. Notz, Michael A. FlignerPublisher:W. H. Freeman
 Introduction to the Practice of StatisticsStatisticsISBN:9781319013387Author:David S. Moore, George P. McCabe, Bruce A. CraigPublisher:W. H. Freeman
MATLAB: An Introduction with Applications
Statistics
ISBN:9781119256830
Author:Amos Gilat
Publisher:John Wiley & Sons Inc
Probability and Statistics for Engineering and th...
Statistics
ISBN:9781305251809
Author:Jay L. Devore
Publisher:Cengage Learning
Statistics for The Behavioral Sciences (MindTap C...
Statistics
ISBN:9781305504912
Author:Frederick J Gravetter, Larry B. Wallnau
Publisher:Cengage Learning
Elementary Statistics: Picturing the World (7th E...
Statistics
ISBN:9780134683416
Author:Ron Larson, Betsy Farber
Publisher:PEARSON
The Basic Practice of Statistics
Statistics
ISBN:9781319042578
Author:David S. Moore, William I. Notz, Michael A. Fligner
Publisher:W. H. Freeman
Introduction to the Practice of Statistics
Statistics
ISBN:9781319013387
Author:David S. Moore, George P. McCabe, Bruce A. Craig
Publisher:W. H. Freeman
Statistics 4.1 Point Estimators; Author: Dr. Jack L. Jackson II;https://www.youtube.com/watch?v=2MrI0J8XCEE;License: Standard YouTube License, CC-BY
Statistics 101: Point Estimators; Author: Brandon Foltz;https://www.youtube.com/watch?v=4v41z3HwLaM;License: Standard YouTube License, CC-BY
Central limit theorem; Author: 365 Data Science;https://www.youtube.com/watch?v=b5xQmk9veZ4;License: Standard YouTube License, CC-BY
Point Estimate Definition & Example; Author: Prof. Essa;https://www.youtube.com/watch?v=OTVwtvQmSn0;License: Standard Youtube License
Point Estimation; Author: Vamsidhar Ambatipudi;https://www.youtube.com/watch?v=flqhlM2bZWc;License: Standard Youtube License