
Videos
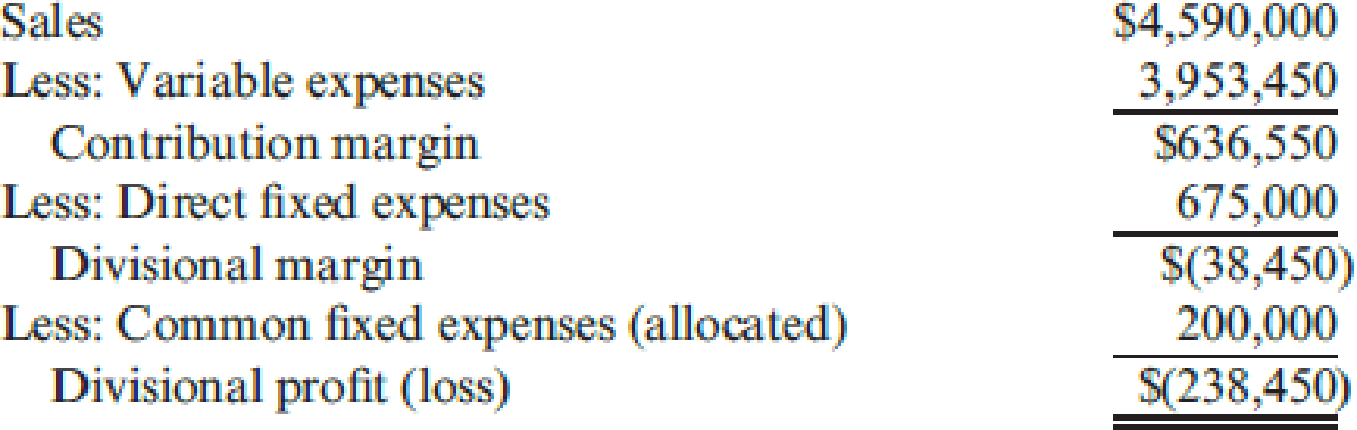
Dantrell Palmer has just been appointed manager of Kirchner Glass Products Division. He has two years to make the division profitable. If the division is still showing a loss after two years, it will be eliminated, and Dantrell will be reassigned as an assistant divisional manager in another division. The divisional income statement for the most recent year is as follows:
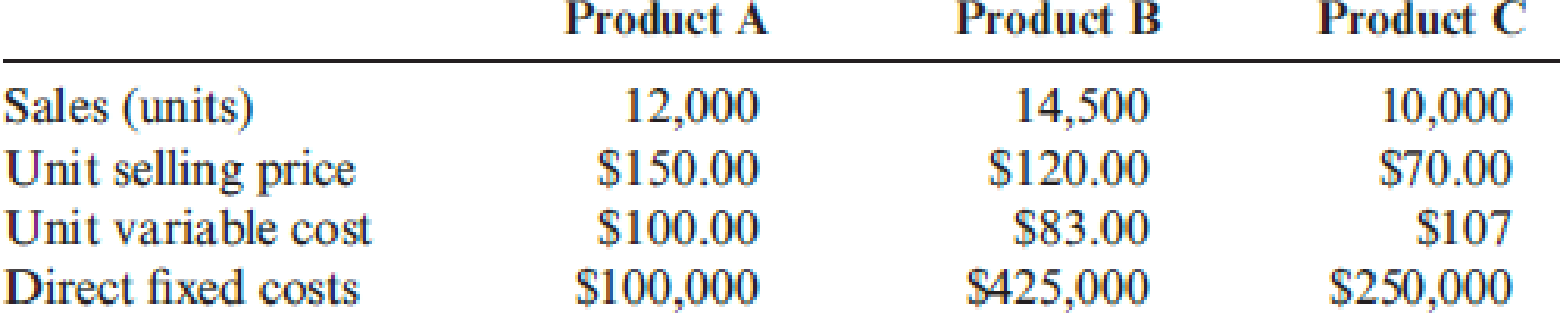
Upon arriving at the division, Dantrell requested the following data on the division’s three products:
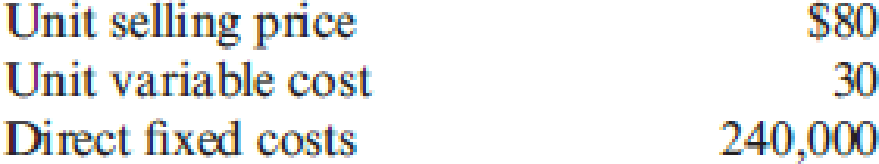
He also gathered data on a proposed new product (Product D). If this product is added, it would displace one of the current products; the quantity that could be produced and sold would equal the quantity sold of the product it displaces, although demand limits the maximum quantity that could be sold to 20,000 units. Because of specialized production equipment, it is not possible for the new product to displace part of the production of a second product. The information on Product D is as follows:
Required:
- 1. Prepare segmented income statements for Products A, B, and C.
- 2. Determine the products that Dantrell should produce for the coming year. Prepare segmented income statements that prove your combination is the best for the division. By how much will profits improve given the combination that you selected? (Hint: Your combination may include one, two, or three products.)
Want to see the full answer?
Check out a sample textbook solution
Chapter 18 Solutions
Cornerstones of Cost Management (Cornerstones Series)


- The directors of Gaston Bridge plc (GB) are meeting to discuss the annual divisional performance statements produced by the company’s five divisions. The target ROI for all divisions is 10.7%, and the divisions have all managed to turn in performance in excess of that figure, with the highest ROI of 12.6% from Division X. One recently-appointed director is unimpressed by these figures. Before joining GB, he had been manufacturing director at Darron Smith plc, one of GB’s major competitors. He tells his fellow directors that they should be expecting a much better performance from their divisions: ‘ROI of 10.7% is too low a target. At Darron Smith, our divisional targets were always in excess of 20%, and divisions generally managed to meet them. We’re not setting our sights high enough’. Suggest reasons why the comparison between ROI in the two companies might be invalid.”arrow_forwardForchen, Inc., provided the following information for two of its divisions for last year: Required: 1. For the Small Appliances Division, calculate: a. Average operating assets b. Margin c. Turnover d. Return on investment (ROI) 2. For the Cleaning Products Division, calculate: a. Average operating assets b. Margin c. Turnover d. Return on investment (ROI) 3. What if operating income for the Small Appliances Division was 2,000,000? How would that affect average operating assets? Margin? Turnover? ROI? Calculate any changed ratios (round to four significant digits).arrow_forwardKent Tessman, manager of a Dairy Products Division, was pleased with his divisions performance over the past three years. Each year, divisional profits had increased, and he had earned a sizable bonus. (Bonuses are a linear function of the divisions reported income.) He had also received considerable attention from higher management. A vice president had told him in confidence that if his performance over the next three years matched his first three, he would be promoted to higher management. Determined to fulfill these expectations, Kent made sure that he personally reviewed every capital budget request. He wanted to be certain that any funds invested would provide good, solid returns. (The divisions cost of capital is 10 percent.) At the moment, he is reviewing two independent requests. Proposal A involves automating a manufacturing operation that is currently labor intensive. Proposal B centers on developing and marketing a new ice cream product. Proposal A requires an initial outlay of 250,000, and Proposal B requires 312,500. Both projects could be funded, given the status of the divisions capital budget. Both have an expected life of six years and have the following projected after-tax cash flows: After careful consideration of each investment, Kent approved funding of Proposal A and rejected Proposal B. Required: 1. Compute the NPV for each proposal. 2. Compute the payback period for each proposal. 3. According to your analysis, which proposal(s) should be accepted? Explain. 4. Explain why Kent accepted only Proposal A. Considering the possible reasons for rejection, would you judge his behavior to be ethical? Explain.arrow_forward
- Millard Corporation is a wholesale distributor of office products. It purchases office products from manufacturers and distributes them in the West, Central, and East regions. Each of these regions is about the same size and each has its own manager and sales staff The company has been experiencing losses for many months. In an effort to improve performance, management has requested that the monthly income statement be segmented by sales region. The company's first effort at preparing a segmented income statement for May is given below. Sales Regional expenses traceable): Cost of goods sold Advertising Salaries Utilities Depreciation Shipping expense Total regional expenses Regional income (less) before corporate expenses Corporate expenses Advertising (general) General administrative expense Mest $311,000 92,000 110,000 59,000 8.900 25,000 15,000 309,900 1.100 14,000 20,000 34,000 5 (32,900) Sales Region Central $800,000 245,000 245,000 59,000 15,500 33,000 28,000 hiso 2 East…arrow_forwardRecognising that there would be fierce competition to regain lost markets, Management felt that there should be a renewed focus on the productivity and profitability of the operations. The productivity analysis would focus on the Manufacturing department, and the profitability would examine both products. To conduct this analysis, you have extracted the following information for the Manufacturing Department for the month of January: At the start of the month there were 1,000 units in stock, which were 20% complete with respect to conversion costs, and was valued at $ 16,000. During the month, 9,000 units were introduced to the production. At the end of the month there were 1,000 units in stock which were 40% complete with respect to conversion costs. All Materials are added at the start of the process. Costs incurred for the month were: Materials - $ 63,000; Conversion costs - $ 139,840. The Department uses a FIFO costing system. Further examination of the records showed the…arrow_forwardRecognising that there would be fierce competition to regain lost markets, Management felt that there should be a renewed focus on the productivity and profitability of the operations. The productivity analysis would focus on the Manufacturing department, and the profitability would examine both products. To conduct this analysis, you have extracted the following information for the Manufacturing Department for the month of January: At the start of the month there were 1,000 units in stock, which were 20% complete with respect to conversion costs, and was valued at $ 16,000. During the month, 9,000 units were introduced to the production. At the end of the month there were 1,000 units in stock which were 40% complete with respect to conversion costs. All Materials are added at the start of the process. Costs incurred for the month were: Materials - $ 63,000; Conversion costs - $ 139,840. The Department uses a FIFO costing system. Further examination of the records showed the…arrow_forward
- Navarre Energy Research specializes in developing and commercializing new products. It is organized into two divisions, which are based on the products they produce. Canal Division is smaller, and the lives of the products it produces tend to be shorter than those produced by the larger Lake Division. Selected financial data for the past year are shown in the following table. Divisional investment is as of the beginning of the year. Navarre uses an 8 percent cost of capital and beginning-of-the-year investment when computing ROI and residual income. Ignore income taxes. Division Canal ($000) Lake ($000) Allocated corporate overhead $ 4,100 $ 9,600 Cost of goods sold 20,000 30,000 Divisional investment 60,100 400,000 R&D 12,000 32,000 Sales 50,000 100,000 Selling, general and administrative (excluding R&D) 4,500 8,000 R&D is assumed to have a three-year life in Canal Division and an eight-year life in Lake Division. All R&D expenditures are spent…arrow_forwardNavarre Energy Research specializes in developing and commercializing new products. It is organized into two divisions, which are based on the products they produce. Canal Division is smaller, and the lives of the products it produces tend to be shorter than those produced by the larger Lake Division. Selected financial data for the past year are shown in the following table. Divisional investment is as of the beginning of the year. Navarre uses an 8 percent cost of capital and beginning-of-the-year investment when computing ROI and residual income. Ignore income taxes. Division Canal ($000) Lake ($000) Allocated corporate overhead $ 4,100 $ 9,600 Cost of goods sold 20,000 30,000 Divisional investment 60,100 400,000 R&D 12,000 32,000 Sales 50,000 100,000 Selling, general and administrative (excluding R&D) 4,500 8,000 Required: Compute divisional income for the two divisions. Calculate the operating margin, which is equivalent to the return on sales,…arrow_forwardYou have recently been appointed as the management accountant attached to the head office of the company with special responsibility of monitoring the performance of the companies within the group. Each company is treated as an investment center and every month produces an operating statement for the group headquarters. Summaries of the statements for companies X and Y which make similar products selling at similar prices for the last month showed a typical situation. Extract from the company monthly operating statements. X Y GHS000 GHS000 Sales 600 370 Less variable cost 229 208 Contribution 371 162 Less controllable fixed…arrow_forward
- Millard Corporation is a wholesale distributor of office products. It purchases office products from manufacturers and distributes them in the West, Central, and East regions. Each of these regions is about the same size and each has its own manager and sales staff. The company has been experiencing losses for many months. In an effort to improve performance, management has requested that the monthly income statement be segmented by sales region. The company's first effort at preparing a segmented income statement for May is given below. Sales Regional expenses (traceable): Cost of goods sold Advertising Salaries Utilities Depreciation Shipping expense Total regional expenses Regional income (loss) before corporate expenses Corporate expenses: Advertising (general) General administrative expense Total corporate expenses Net operating income (loss) West $ 312,000 94,000 100,000 56,000 8,600 25,000 16,000 299,600 12,400 13,000 20,000 33,000 $ (20,600) Sales Region Central $ 796,000…arrow_forwardMillard Corporation is a wholesale distributor of office products. It purchases office products from manufacturers and distributes them in the West, Central, and East regions. Each of these regions is about the same size and each has its own manager and sales staff. The company has been experiencing losses for many months. In an effort to improve performance, management has requested that the monthly income statement be segmented by sales region. The company's first effort at preparing a segmented income statement for May is given below. Sales Regional expenses (traceable): Cost of goods sold Advertising Salaries Utilities Depreciation Shipping expense Total regional expenses Regional income (loss) before corporate expenses Corporate expenses: Advertising (general) General administrative expense Total corporate expenses Net operating income (loss) Variable expenses: Total variable expenses Traceable fixed expenses: Total traceable fixed expenses Common fixed expenses: Total common…arrow_forwardMillard Corporation is a wholesale distributor of office products. It purchases office products from manufacturers and distributes them in the West, Central, and East regions. Each of these regions is about the same size and each has its own manager and sales staff. The company has been experiencing losses for many months. In an effort to improve performance, management has requested that the monthly income statement be segmented by sales region. The company’s first effort at preparing a segmented income statement for May is given below. Sales Region West Central East Sales $ 311,000 $ 796,000 $ 703,000 Regional expenses (traceable): Cost of goods sold 94,000 240,000 312,000 Advertising 105,000 236,000 240,000 Salaries 54,000 54,000 107,000 Utilities 8,700 16,100 13,600 Depreciation 21,000 35,000 28,000 Shipping expense 17,000 31,000 36,000 Total regional expenses 299,700 612,100 736,600 Regional income (loss) before corporate expenses 11,300…arrow_forward
 Cornerstones of Cost Management (Cornerstones Ser...AccountingISBN:9781305970663Author:Don R. Hansen, Maryanne M. MowenPublisher:Cengage Learning
 Financial And Managerial AccountingAccountingISBN:9781337902663Author:WARREN, Carl S.Publisher:Cengage Learning,
 Managerial AccountingAccountingISBN:9781337912020Author:Carl Warren, Ph.d. Cma William B. TaylerPublisher:South-Western College Pub