
To calculate: The thermocline depth and the flux across the interface by the use of a cubic spline fit where
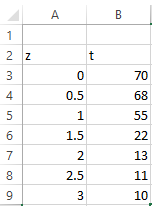
| Depth, m | 0 | 0.5 | 1.0 | 1.5 | 2.0 | 2.5 | 3.0 |
| Temperature, Celsius | 70 | 68 | 55 | 22 | 13 | 11 | 10 |
The provided graph shows the relationship between depth and temperature as,

Answer to Problem 6P
Solution:
The value of thermocline depth and the flux across the interface is
Explanation of Solution
Given Information:
The table is given as,
| Depth, m | 0 | 0.5 | 1.0 | 1.5 | 2.0 | 2.5 | 3.0 |
| Temperature, Celsius | 70 | 68 | 55 | 22 | 13 | 11 | 10 |
The provided graph shows the relationship between depth and temperature as,
Calculation:
Consider the Fourier’s law,
The value of
From the graph, this can be interpreted that curve has zero slope at
Since, the cubic spline fit is required, so this problem can be solved by the Excel VBA(Visual Basic for applications). The steps are,
Step 1. Insert the data in excel as shown below,
Step 2. Press ALT+F11 and write the code as shown below,
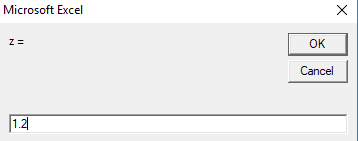
Step 3. Press RUN then this dialog box appears.

Step 4. Enter the value of z.
Step 5. This output will appear.
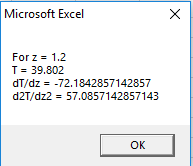
Thus, the value of
Hence, the value of thermocline depth and the flux across the interface is
Want to see more full solutions like this?
Chapter 20 Solutions
Numerical Methods for Engineers

- A stamped sheet steel plate is shown in Figure 164. Compute dimensions AF to 3 decimal places. All dimensions are in inches. A=_B=_C=_D=_E=_F=_arrow_forwardTsunami Waves and BreakwatersThis is a continuation of Exercise 16. Breakwaters affect wave height by reducing energy. See Figure 5.30. If a tsunami wave of height H in a channel of width W encounters a breakwater that narrows the channel to a width w, then the height h of the wave beyond the breakwater is given by h=HR0.5, where R is the width ratio R=w/W. a. Suppose a wave of height 8 feet in a channel of width 5000feet encounters a breakwater that narrows the channel to 3000feet. What is the height of the wave beyond the breakwater? b. If a channel width is cut in half by a breakwater, what is the effect on wave height? 16. Height of Tsunami WavesWhen waves generated by tsunamis approach shore, the height of the waves generally increases. Understanding the factors that contribute to this increase can aid in controlling potential damage to areas at risk. Greens law tells how water depth affects the height of a tsunami wave. If a tsunami wave has height H at an ocean depth D, and the wave travels to a location with water depth d, then the new height h of the wave is given by h=HR0.25, where R is the water depth ratio given by R=D/d. a. Calculate the height of a tsunami wave in water 25feet deep if its height is 3feet at its point of origin in water 15,000feet deep. b. If water depth decreases by half, the depth ratio R is doubled. How is the height of the tsunami wave affected?arrow_forwardFind the intensities of earthquakes whose magnitudes are (a) R=6.0 and (b) R=7.9.arrow_forward
- Which table has a constant of proportionality y and x of 0.6arrow_forwardAn engineer is studying the effect of cutting speed on the rate of metal removal in a machining operation. However, the rate of metal removal is also related to the hardness of the test specimen. Five observations are taken at each cutting speed. The amount of metal removed (y) and the hardness of the specimen (x) are shown in the following table. Cutting Speed (rpm) 1000 1200 1400 68 120 112 165 118 175 06 90 98 140 94 140 82 132 150 65 120 73 124 77 125 74 125 92 141 88 136 85 133 80 130arrow_forwardII. Consider an object in a surrounding with constant temperature of 25°C. If the temperature of the object decreases from 100°C to 90°C in 10 minutes, how much longer will it take for its temperature to cool to 80°C ?arrow_forward
- 6.9 In an electrophoretic fiber-making process, the diameter of the fiber, d, is related to the current flow, 1. The following are measured during production: I (NA) d (μm) 300 22 300 26 350 27 400 30 400 34 500 33 500 33.5 650 37 650 42 The relationship between the current and the diameter can be modeled with an equation of the form d = a + b.I. Use the data to determine the constants a and b that best fit the data.arrow_forward6. 257 - 134% D %3D 7. 457-242% D %3D 8. 498- 276 = %3D 9. 849 - 615 = %3Darrow_forward. At wind speeds above 1000 cm/sec, significant sand–moving events begin to occur. Wind speeds below 1000 cm/sec deposit sand and wind speeds above 1000 cm/sec move sand to new locations. The cyclic nature of wind and moving sand determines the shape and location of large dunes. At a test site, the prevailing direction of the wind did not change noticeably. However, the velocity did change. 75 wind speed readings gave an average velocity of x =1045 cm/sec. Based on long–term experience, can be assumed to be 240 cm/sec Find a 99% confidence interval for the population mean wind speed at this site. (Round your answers to the nearest whole number) (DO A MANUAL CALCULATION, SHOWING ALL WORK INCLUDING THE EQUATION USED AND THEN WITH ALL VALUES PLUGGED INTO THE EQUATION)(SHOW WORK ABOVE) [final answer] Margin of Error: E = (value with units)[final answer] Confidence Interval : _________________ < __________________ < __________________ (value with units) (correct symbol) (value with…arrow_forward
- 1. The chart below shows the current speed of the Colorado River taken at different times throughout the day. There were no abnormal flows that varied from the speeds shown in the chart. Time Speed (mph) 12:00 PM 24.5 12:10 PM 30 12:20 PM 32 12:30 PM 31.5 12:40 PM 25.5 A. Use trapezoids to estimate the river's average current speed from 12:00 PM until 12:40 PM.arrow_forwardShow solution, do not use excel 1. A study was conducted to compare three methods of measuring concentration of certain type of chemical pollutants in a lake. The data is given in Table 1 below. a. Compute SS(between) and SS(within). b. Compute SS(total), and explain the relationship between SS(between), SS(within), and SS(total). c. Compute MS(between), MS(within), and F statistic. d. Based on your computations, are there significant differences in the mean pollutant concentrations among the three methods? Table 1. Amount of concentration of a chemical pollutant in a lake using three different measuring methods Method 1 Method 2 Method 3 10.96 10.88 10.73 10.75 10.80 10.77 10.79 10.90 10.78 10.82 10.69 10.81 10.87 10.70 10.88 10.6 10.82 10.81arrow_forwardThe efficiency for a steel specimen immersed in a phosphating tank is the weight of the phosphate coating divided by the metal loss (both in mg/ft2). An article gave the accompanying data on tank temperature (x) and efficiency ratio (y). Temp. 171 Ratio y = Ratio Temp. 181 181 173 Ratio 0.76 1.35 1.44 Temp. 183 183 174 1.53 1.58 1.69 USE SALT 181 175 1.09 181 175 176 1.05 1.18 181 182 177 183 185 185 186 0.98 182 2.11 2.19 0.92 1.45 187 1.71 1.98 2.62 1.43 2.56 2.96 1.95 178 1.88 183 1.00 189 3.14 (a) Determine the equation of the estimated regression line. (Round all numerical values to four decimal places.) (b) Calculate a point estimate for true average efficiency ratio when tank temperature is 183. (Round your answer to four decimal places.) (c) Calculate the values of the residuals from the least squares line for the four observations for which temperature is 183. (Round your answers to two decimal places.) (183, 1.00) (183, 1.71) (183, 1.98) (183, 2.62) Why do they not all have…arrow_forward
 Algebra & Trigonometry with Analytic GeometryAlgebraISBN:9781133382119Author:SwokowskiPublisher:Cengage
 Functions and Change: A Modeling Approach to Coll...AlgebraISBN:9781337111348Author:Bruce Crauder, Benny Evans, Alan NoellPublisher:Cengage Learning
 Mathematics For Machine TechnologyAdvanced MathISBN:9781337798310Author:Peterson, John.Publisher:Cengage Learning,
 Algebra: Structure And Method, Book 1AlgebraISBN:9780395977224Author:Richard G. Brown, Mary P. Dolciani, Robert H. Sorgenfrey, William L. ColePublisher:McDougal Littell